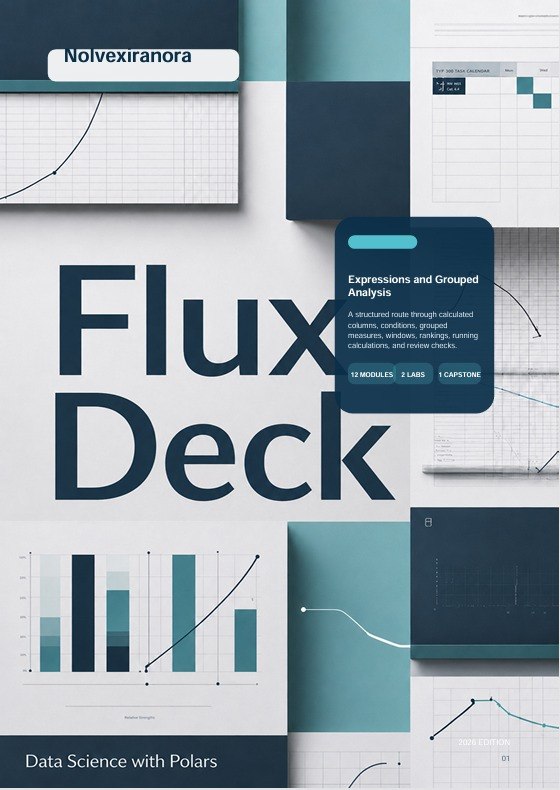
Abstract digital graphic with flowing white and teal wave shapes layered over dark navy and gray panels, overlaid with charts, graphs, lines, and small text blocks.

Turn Structured Data Into Clear Analytical Workflows

Abstract digital background with layered teal and white flowing shapes over a dark navy field, overlaid with thin white line charts, grids, and data points.

Explore the Courses

Shop all

Making Data Work Feel Clearer

Our mission is to provide structured Data Science with Polars courses that connect clear explanations with practical exercises. Each module is designed to help learners understand why an analytical step is used, how it changes the data, and where it belongs within a wider workflow.

Built Around a Better Way to Study Data

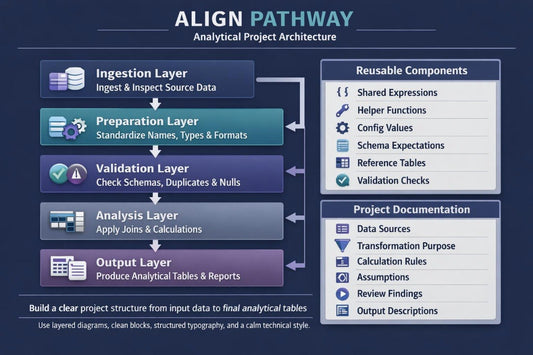
Nolvexiranora began after our team noticed that many data science materials explained individual operations without showing how they connect inside a full workflow. We created a learning route that brings data inspection, preparation, expressions, table relationships, validation, and analytical planning into one organized course structure.

30-days refund guarantee

Try the course completely risk-free. We want you to be fully confident in your investment, so if you're not satisfied with the content for any reason, you can get a full refund. No questions asked, and no hoops to jump through. Refund requests may be submitted within 30 days of purchase in accordance with our Refund Policy.

  • Susan Winslow

    Susan Winslow

    Susan started with experience in basic data analysis but found table conections and grouped calculations difficult to arrange clearly. She wanted learning materials that explained joins, expressions, and summaries through connected examples. The diagrams and gradual exercises helped her examine each relationship before combining several datasets. “The examples made it easier to see how keys, joins, and grouped measures belong within the same analytical route.”

  • Patrik Alder

    Patrik Alder

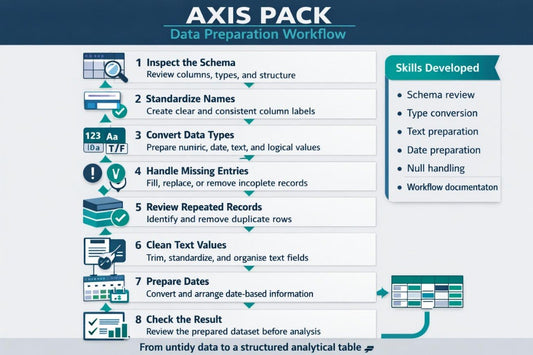
    Patrik began studying with a basic understanding of tables and filtering but found it difficult to connect individual operations into a complete analytical workflow. He wanted a clearer way to organize preparation, joins, calculations, and review stages. The structured module sequence and practical workflow diagrams helped him understand how each task relates to the next. “The course gave me a clearer framework for organizing data work from the first inspection to the final summary.”

  • A person sitting cross-legged holds a tablet displaying a digital course or module titled 'Vault Module' against a bright white background.
  • A smartphone lying diagonally across an open silver laptop on a white background, displaying a presentation slide titled 'Axis Pack' with teal and white geometric charts.
  • Black electronic device with a screen displaying graphics on a white background

Begin With a Free Polars Learning Set

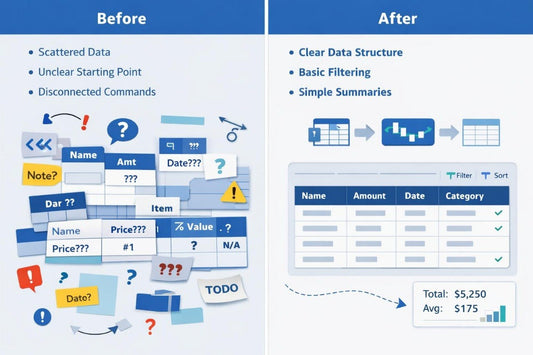
Start with introductory materials designed to explain the foundations of structured data work. Explore rows, columns, schemas, filtering, sorting, missing values, and simple analytical summaries. The Free Set offers a practical introduction to the teaching style and organization used throughout Nolvexiranora. Download the materials and study each section according to your own schedule.

  • A circular digital graphic featuring a stylized network or node diagram with teal, blue, white, and dark gray elements on a solid white background.

    Clear Structure

    Lessons follow a logical sequence that connects foundational concepts with detailed analytical tasks and project-based practice.

  • A stylized square icon or app-style graphic showing a grid layout with teal and gray blocks on a white background, surrounded by a dark teal border.

    Practical Exercises

    Guided activities help learners apply data preparation, expressions, joins, summaries, and validation methods to structured examples.

  • A stylized vector illustration of an open book with teal and navy blue pages, featuring simple diagrams and charts on the cover, set against a solid white background.

    Workflow Focus

    Course materials explain how separate operations connect across inspection, preparation, analysis, review, and output stages.

  • A stylized digital icon of a bar chart and line graph inside a rounded square, shown on a plain white background.

    Detailed Guidance

    Examples, visual diagrams, review notes, and checklists support careful study of each topic throughout the learning route.

  • Nicholas Vossler — Columnar Data Engineer

    Nicholas Vossler

    Columnar Data Engineer

    Nicholas designs column-based data workflows for large structured datasets. He prepares schemas, reviews data types, and arranges processing stages with careful attention to resource use. His work connects data organization with practical analytical requirements.

  • Virelia Sutton — Data Pipeline Researcher

    Virelia Sutton

    Data Pipeline Researcher

    Virelia studies how data moves through scanning, selection, filtering, joining, and aggregation stages. She compares workflow structures and reviews where repeated processing can be reduced. Her research supports clearer planning for detailed analytical projects.

  • Rayan Crowe — Data Quality Specialist

    Rayan Crowe

    Data Quality Specialist

    Rayan examines datasets for missing values, repeated records, inconsistent categories, and unsuitable column types. He creates validation checks and documents the reasoning behind data-cleaning decisions. His work supports clearer preparation before deeper analysis begins.

Look Inside the Data Learning Route

Explore how Nolvexiranora courses organize Data Science with Polars into clear learning stages. Review subjects covering data preparation, table relationships, analytical expressions, validation, and workflow planning. Compare the course tiers to find materials that match your current knowledge and study goals. Use the Preview Courses button to examine the available learning routes in greater detail.

  • GitHub logo with a black circle and white cat-like face design
  • LinkedIn logo on a white background
  • Black circle with a white letter 'M' in the center